The performance diagrams of Europeltier air-to-air coolers are based on intensive laboratory testing conducted on each cooler. These tests demonstrate the precise performance of the unit in relation to the ambient temperature or the internal temperature of the system being cooled.
There are two ways to use the diagram. Before starting, select the datasheet for a Europeltier cooler along with its corresponding performance diagram.
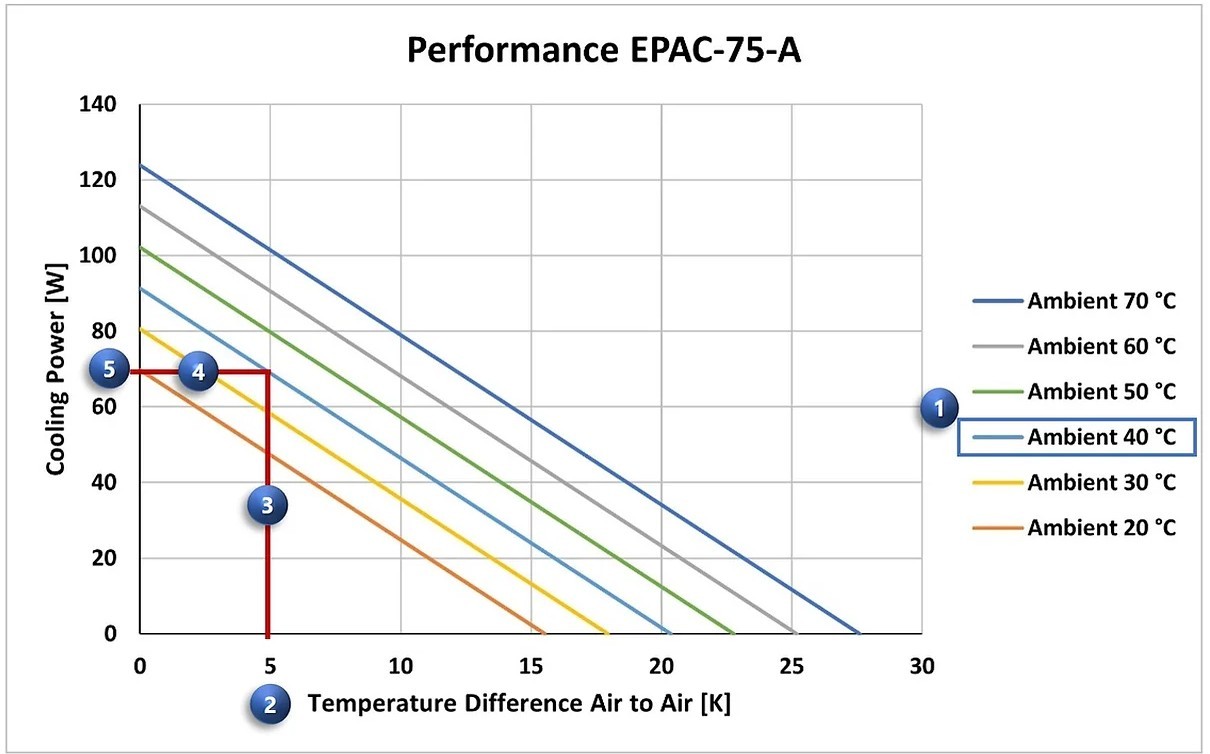
1) Identify the required cooling power (W):
1. Choose a sloped line corresponding to the ambient temperature (e.g., 40 °C);
2. On the X-axis, determine the temperature difference relative to the ambient temperature;
3. Draw a vertical line from that X-axis point up to the selected ambient temperature line;
4. From the point of intersection, draw a horizontal line to the Y-axis;
5. The approximate cooling power can be read on the Y-axis.
Considering an ambient temperature of 40°C and a temperature difference of 5°C relative to the ambient, the power of the Europeltier cooler should be approximately 70 W. Therefore, a 75 W device has the necessary power to provide adequate cooling.
2) Identify the Target Internal Temperature
A. On the Y-axis, locate the value that represents the thermal load measured inside the enclosure to be cooled (e.g., 60 W);
B. Draw a horizontal line from this point to the chosen ambient temperature line (e.g., 40 °C);
C. From the intersection point, draw a vertical line down to the X-axis;
D. The internal temperature will be approximately equal to the ambient temperature minus the value found on the X-axis.
Considering an internal thermal load of 60 W and an ambient temperature of 40 °C, the diagram indicates an approximate value of 7 °C on the X-axis. This means the internal temperature of the enclosure will be around 33 °C (40 °C – 7 °C). Therefore, the 75 W Europeltier cooler provides sufficient power to achieve the desired internal temperature.
NOTES
If the calculated cooling power is insufficient, it will be necessary to select a higher-capacity cooler and re-evaluate using the performance curve of the new unit, as indicated in the datasheets.
Please note that the diagram does not account for heat transfer through the walls of the enclosure to be cooled.
Interested in learning more?
Interested in learning more?
Let us show you the solutions we can offer for your company’s thermal challenges. We provide a free technical feasibility study—no cost, no commitment.